
How Is the Ocean’s Health?
IronViz 2021 Competition
By Yvonne Beirne FitzGerald | Published: July 2021
Project At A Glance
The Ocean Health Index works like a blood pressure reading for our seas. Exploring 2020 status data across 220 regions tracking biodiversity, clean water, food provision, and coastal livelihoods. An entry to IronViz 2021, judged on design, analysis, and storytelling, the world's largest virtual data competition. My background in the life sciences gave me a foundation for understanding the OHI methodology and why focusing on verified status data matters more than future projections.
Intro
DATA+JOY is Tableau's IronViz Theme for 2021. For me, the ocean brings me joy, so keeping the oceans healthy is essential to me. Exploring the Ocean Health Index (OHI) from 2020 allows me to take the temperature of the vital resource. The viz below is my entry into IronViz 2021 and a snapshot of the Ocean's Health based on 2020 status data from the latest OHI dataset.
IronViz competition is hosted by Tableau Software and is the world's largest virtual data visualization competition. Three winners are selected from this qualifier event to compete in the final championship round in November. The benefits of competing in this event are numerous; one key reason is getting feedback from the judges and other members of the visualization community. The judges evaluate the project on three criteria Design, Analysis, and Storytelling.
Interactive Viz Below (Link to Tableau Public)
Viz Backstory
Topic
Even though the project is judged on Design, Analysis, and Storytelling, topic and data selection is critical. The contest theme Data+Joy had me asking, "What brings me joy"? The answer, I love the ocean; being on a shoreline, hearing the waves crashing and the sound of the seabirds bring me great pleasure. Topic selection, thus was easy for me my viz would be about the oceans.
I gave myself one week to focus on a topic and find supporting data. My original objective was very focused - tracking sharks along the coast of New England in the US. Unfortunately, I could not access the data set I wanted to use and could not find another.
I then expanded my focus and found so many fantastic datasets around oceans and marine life. During this exploration period, I found the Ocean Health Index dataset. I found I kept going back to it, digging deeper and enjoying their approach. That is when I knew I had found the dataset I wanted to work on for the next three weeks.
Data
This data set is a multiyear evaluation of ocean health tracking, with ten goals and several subgoals. It is the only one to include humans in the ocean ecosystem. The focus of the data is to evaluate how the ocean provides benefits to people and how we protect the ocean's future.
The Ocean Health Index combines data from many different areas and disciplines to provide a comprehensive overview of the state of oceans. In addition, the team has created tools for global assessment and for working with local groups, so these groups can use the same tools to gain a more detailed understanding of their locale.
Support from Conservation International, Esri, the National Center for Ecological Analysis and Synthesis (NCEAS), the Sea Around Us, the University of British Columbia, the University of California at Santa Barbara, the Pacific Life Foundation, Beau and Heather Wrigley, and many others helps OceanHealthIndex.org do its critical work.
The dataset contains six different dimensions. For this project, I selected to work only with the status dimension for 2020. The status dimension is the latest review of the oceans' data.
The organization results use the score dimension when combining the status and other dimensions, including a future projection in a weighted process to achieve a final score. I was not interested in the future projection dimension since one can't confirm that certain things will happen. That feeling was the driving force of working exclusively with the status dimension.
The data indicate that our oceans are not dead but need our support and work to continue being healthy. Efforts to improve ocean health are critical to the human population now and in the future.
Storytelling
Once the data set is locked in, the next step is defining the story. I found it very interesting that the methodologies of this data set included future projections. Their projects illustrated positive gains the ocean health could make with our help. That became the theme I wanted as my story - all is not lost, our oceans can thrive, and you can help. The support needed is simple and easy to implement into anyone's daily life. I wanted the viewer to connect to their location and take the first step to help their marine ecosystems.
Analysis
Now the fun starts - exploring and playing with the data and diving deeper into the data, and getting a better understanding of its' structure. Each datapoint has six different dimensions. I selected to focus on the status dimension, which indicates how things are currently.
During the deep dive, I became aware that not every goal had a result. The missing info is because the OHI reviews existing data and uses it to create scores for each of their goals. If there is no existing data in the literature, the score for the dimension is missing or null. I thought it was essential to the viewer, especially when viewing their local area results, to know what goals had missing information. This information helps them know other areas they could focus on, understand their score compared to another location, and maybe look into partnering with the Ocean Health Index organization to do a local assessment. I decided the best place to place this was below the local scorecard.
Exploratory analysis is up next, where I create several different views of the data. Finally, I am looking for charts/viz that support the story I want to tell and see if any additional stories or trends pop out. Typically these charts are quick on the fly in default coloring.
Calculations
The analysis uses six calculated fields: tooltip descriptions for each ocean health goal, average and median scoring, null-value counts to flag missing data by region, a classification field that groups countries into three health bands, and a global benchmark display for goal comparison. Full calculation details are available on request.
ToolTip Info
// used to add information about each goal in the tooltips
if [Long Goal] = "Biodiversity" THEN "Estimates how successfully the richness and variety of marine life is being maintained around the world."
ELSEIF
[Long Goal] = "Carbon storage" THEN "Measures the extent and condition of the natural coastal ecosystems - seagrasses, tidal marshes and mangroves - that store large amounts of carbon in their roots, stems and leaves and sequester it for decades or centuries in the sediment. When these habitats and sediments are preserved, air cannot reach the carbon they store. If they are disturbed or destroyed, air reaches the carbon and oxygen oxidizes it to carbon dioxide (CO₂), a heat-trapping gas that is the main source of climate warming."
ELSEIF
[Long Goal] = "Clean water" THEN "Measures contamination by chemicals, excessive nutrients (eutrophication), human pathogens and trash."
ELSEIF
[Long Goal] = "Coastal protection" THEN "Preserving habitats (mangrove forests, seagrass meadows, salt marshes, tropical coral reefs, and sea ice) that safeguards shores storm waves and flooding."
ELSEIF
[Long Goal] = "Economies" THEN "Economies, a subgoal of the Revenue goal, evaluates both the job and revenues produced from marine related industries both direct and indirect. The marine sectors evaluated include - 1) Commercial fishing, 2) Mariculture, 3) Tourism and recreation, 4) Shipping and transportation, 5) Whale watching, 6) Ports and harbors, 7) Ship and boat building, and 8) Renewable energy production (wind and wave)."
ELSEIF
[Long Goal] = "Food provision" THEN "Measures the amount of seafood captured or raised in a sustainably."
ELSEIF
[Long Goal] = "Habitat (subgoal)" THEN "Evaluates the conservation status of six habitats (mangroves, coral reefs, seagrass beds, salt marshes, sea ice, and subtidal soft-bottom habitats), which are important in supporting large numbers of marine species. The current habitat is compare to 1980 health."
ELSEIF
[Long Goal] = "Natural products" THEN "Harvesting Non-Food Ocean Resources (seashells, sponges, aquarium fish, and natural products) sustainably."
ELSEIF
[Long Goal] = "Iconic species (subgoal)" THEN "Iconic species (Sense of Place Subgoal) are those marine animals who are important to traditional activities, ethnic or religious practices, existence value, or locally valued."
ELSEIF
[Long Goal] = "Lasting special places (subgoal)" THEN "Lasting Special Places - Sense of Place Subgoal measures geographic locations that are valuable for aesthetic, spiritual, cultural, recreational, or existence reasons. "
ELSEIF
[Long Goal] = "Livelihoods" THEN "The Livelihoods a sub-goal of revenues measures the number of marine-related jobs relative to a country’s growth (or decline) in employment rates over the last five years. The quality of those jobs are evaluated based on the wages received. The marine sectors consists of these job sectors: 1) commercial fishing 2) mariculture 3) tourism and recreation 4) shipping and transportation 5) whale watching 6) ports and harbors 7) ship and boat building 8) renewable energy production (wind and wave)."
ELSEIF
[Long Goal] = "Artisanal opportunities" THEN "Artisanal Fishing Opportunities or the ablity for people who need to fish on a small, local scale can. "
ELSEIF
[Long Goal] = "Mariculture (subgoal)" THEN "Mariculture is the commercial harvest of seafood that is farm-raised in the ocean and along the coast."
ELSEIF
[Long Goal] = "Livelihoods & economies" THEN "The ocean provides revenue in the form of livelihoods and economic stability of the coastal communities."
ELSEIF
[Long Goal] = "Sense of place" THEN "People derive a sense of identity or value from living near the ocean, visiting coastal or marine locations or just knowing that such places and their characteristic species exist. This goal tries to capture the aspects of the coastal and marine system that people value as part of their cultural identity by measuring two subgoals: the condition of iconic species and the condition of lasting special places. Iconic species and protected places symbolize the cultural, spiritual, aesthetic and other intangible benefits that people value for a region."
ELSEIF
[Long Goal] = "Species condition (subgoal)" THEN "Species measures the status of conservation based on the data of how many are listed as endangered or threatened."
ELSEIF
[Long Goal] = "Tourism & recreation" THEN "Coastal and marine tourism is a vital part of a country’s economy. This goal measures the proportion of the total labor force engaged in the coastal tourism and travel sector, factoring in unemployment and sustainability."
ELSEIF
[Long Goal] = "Fisheries (subgoal)" THEN "Wild Fisheries, a Food Provision subgoal, measures the amount of wild-caught seafood that can be sustainably harvested."
END
c Average Value
// calculates the average of index result
AVG([Value])
c Count of Null
//counts the number times present used when filtering on null
COUNTD([Long Goal])
c Display Global Value
// Adds the global score for each goal for top tips information
if [Long Goal] = "Biodiversity" THEN 83
ELSEIF
[Long Goal] = "Carbon storage" THEN 78
ELSEIF
[Long Goal] = "Clean water" THEN 70
ELSEIF
[Long Goal] = "Coastal protection" THEN 85
ELSEIF
[Long Goal] = "Economies" THEN 88
ELSEIF
[Long Goal] = "Food provision" THEN 49
ELSEIF
[Long Goal] = "Habitat (subgoal)" THEN 88
ELSEIF
[Long Goal] = "Natural products" THEN 66
ELSEIF
[Long Goal] = "Iconic species (subgoal)" THEN 61
ELSEIF
[Long Goal] = "Lasting special places (subgoal)" THEN 56
ELSEIF
[Long Goal] = "Livelihoods" THEN 77
ELSEIF
[Long Goal] = "Artisanal opportunities" THEN 74
ELSEIF
[Long Goal] = "Mariculture (subgoal)" THEN 7
ELSEIF
[Long Goal] = "Livelihoods & economies" THEN 82
ELSEIF
[Long Goal] = "Sense of place" THEN 59
ELSEIF
[Long Goal] = "Species condition (subgoal)" THEN 77
ELSEIF
[Long Goal] = "Tourism & recreation" THEN 51
ELSEIF
[Long Goal] = "Fisheries (subgoal)" THEN 52
END
c Good vs Bad
// create classification on each country’s score to enable color coding
IF [c Average Value] < 70 then "Needs Some Work"
ELSEIF[c Average Value] < 80 then "Looking Good"
ELSEIF [c Average Value] >79.9 then "Looking Healthy"
Else "Other"
END
c Median Value
// Determines the medium result for the value column
MEDIAN([Value])
c Number of Countries
// counts the number of countries used with long goals
COUNTD([Country])
c Number of Goals
// counts the number of times a long goal is present to see if information is missing
COUNTD([Long Goal])

Parameter Information

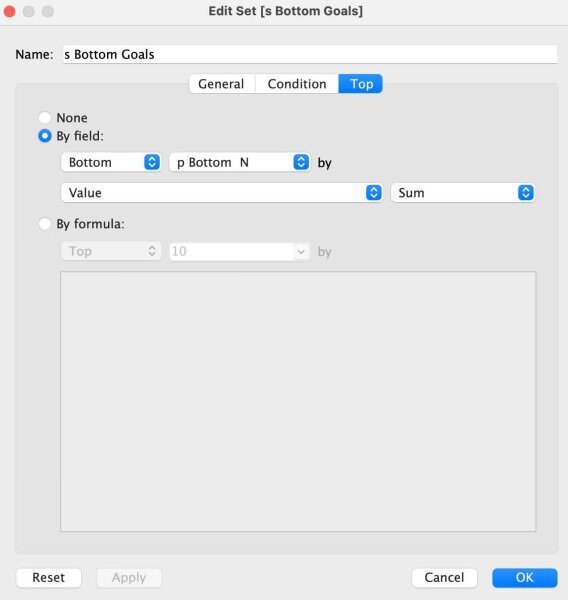
Set Information

Design
Of the three criteria used for judging IronViz entries, this one I would say is a weakness. Before the IronViz announcement, improving my design chops was on my 90-day self-challenge to start in June. Every 90 days, I select one or two items to focus on for improvement. June-Aug goals were 1) to improve design visuals to a more professional level and 2) to work on advanced level tableau calculations to prep for the certification exam.
I was not originally planning on entering IronViz, but I am glad I did. Two side benefits of working on an IronViz entry were things I did not expect. The first is that the #DataFam community on Twitter upped its support. I would not have thought that was possible. The number of high-level tips & tricks to the level of your work from the Advance Community members was unbelievable. Even just taking the time to read their blogs and watch their presentation improved my design skills quicker than I could do on my own. The second benefit was many of these same elite #DataFam members offered to do viz review.
Viz Review
I was lucky and received viz review from two people. I used them at the end; next time, I would bring them in earlier. Jax, my first viz review help me break a habit. All my vizs were single sheet no more than 1200x800 size. I did this to create a viz that would fit into Instagram easily when I first started. This artificial barrier meant that I never tried or even thought about doing a long-form viz. When I shared my single sheet viz, my question was how do I make it look more professional, the info was there, but the wow factor was missing. She agreed and was very kind.
In looking back, it was a cluttered hot mess. The first answer was to try a long-form and use Figma. Once she said long-form, that opened up this option that I had forgotten existed and never used. She also supplied me information on how to get started with Figma and explained how I could use this software to add that professional polish. I believe this knowledge will be critical in helping take my viz to the next level in the future. Due to only having one week left to create a final viz, after a brief exploration of Figma, I decide to learn this software package after the IronViz deadline.
My second review was Zach. He helped me do a final review and caught something significant. One of my charts had a readability issue due to color that came up during the long-form changeover. I knew it was there initially but did not adjust it because I wasn't sure it would be the final color choice. Over time I got used to how it looked and did not see the problem—having a second pair of eyes brought focus again to the issue. This small change had a significant impact on the usability of the viz. I am thrilled I reached out to have that final look-see.
Long Form Viz Design
Switching to the long-form from a single 1200x800 sheet opens up one's ability to tell a story, adds breathing room to the information. Of course, there is a time and place for a single sheet viz, but I think long-form is critical when looking to create a complete story viz. I wish I had the time to learn Figma and make a more significant impact on the design. However, for a beginning attempt, I am pleased with what I was able to achieve.
I used Canva, a tool I know to do the title and quote block. The font used in the title block is Abyssopelagic. I used the Didot font for the quote selection, Lato for the name, and Montserrat for their title. There are two tricks for using images like this in a Tableau dashboard. The first is to make the file the exact size as the space you want to fill. The second is the first container you place on your dashboard; Tableau automatically puts an 8 px board around it. By doing this, you lose the full bleed. To keep the full-bleed, reduce the outer padding.
Color Selection
With any viz, color selection is both critical and a part I enjoy. My first colors were a light tropical blue and gray. It just didn't feel right. When looking for an image to use as a title, I wanted an underwater photo. I fell in love with the one used since it had a school of fish as well as a sunbeam. I used ImageColorPicker.com to pull the colors from the photograph to use as a background for each section with the picture selected. For the warning state data, I decided on an orange color to act as a warning. The good news data, I picked a bright, happy, tropical blue color. I named this palette IronOcean and have a blog post with details.

| Title, Text, Footer | #C4D4D9 | Beau Blue |
| Positive Result, Highlight Text | #41B7C4 | Maximum Blue Green |
| Highlight Text | #F0007B | Flickr Pink |
| Negative Result, Highlight Text | #F4743B | Orange Crayola |
| Background | #02343B | Rich Black |
| Background | #03172B | Oxford Blue |
Project Summary
I loved creating an entry for IronViz. I will definitely do this again. It wasn't something I had on my to-do list until 2022. So when the announcement came out, I thought, why not try it and see how far I get. The first thing I did was create four milestone due dates to keep me on track. Each one was a week long. They were:
Find a dataset & topic
Data exploration
Dashboard design
Review and revisions.
I kept to the due dates and achieved the goals earlier than expected. However, the dashboard design took a bit longer and was the focus of week four. This goal required me to create a different approach to design. I don't feel I match the visual polish that past winners achieved, but I upped my abilities. I am pleased with how much I improved.
Lesson Learned
Several key takeaways from entering this competition:
I would spend less time looking for a data set. This change would give me more time for the revision process.
I would write the text up earlier in the process. This process change provides the benefit of having the text written up in the beginning. I could potentially change it to something more visual, less wall of text.
I only used one dataset; it wasn't until later I used an additional reference to complete the story. I would embrace the idea of multiple data sets earlier in the process.
External review, earlier and more often, is next year's motto. I waited until I felt things were done before sharing. I think I lost some feedback opportunities.
Gifts Of Entering
I am surprised by how much I got out of this competition. I feel my knowledge leveled up, big and small ways. In addition, the #DataFam community, which is always sharing, stepped up in ways I did not anticipate. For example, the elite Tableau users shared tips, tricks, how-to, and viz review opportunities. This information accelerated my skills. I am very grateful to the community for all they did. As a result, my final viz was so much better than I dreamed when I started.
For The Curious
What is the Ocean Health Index?
The Ocean Health Index is the only global measure of ocean health that includes both the state of marine ecosystems and human benefits. It evaluates 10 goals, including biodiversity, clean water, food provision, coastal livelihoods, and sense of place across 220-plus regions annually.
What does this project show?
Exploring 2020 OHI status scores for countries and coastal regions worldwide. Each area's performance is mapped across all 10 ocean health goals, highlighting which goals have missing data and what actions individuals can take to help.
Why was only the status dimension of OHI data used?
The status dimension reflects current, verified ocean conditions. The OHI also includes future projection dimensions, but those involve assumptions about future behavior. Focusing solely on status data keeps the findings factual and grounded in observable measurements.
What color palette was used in this project?
The IronOcean palette was custom-created for this project, pulling colors directly from an underwater photograph. Key colors include Rich Black (#02343B) for background, Maximum Blue Green (#41B7C4) for positive results, and Orange Crayola (#F4743B) for areas needing improvement.
What is IronViz?
IronViz is Tableau's annual global competition and the world's largest virtual data competition. Entries are judged on design, analysis, and storytelling. The 2021 theme was Data and Joy.
Links, References, & Citation
Citation
Oceana Health: Ocean Health Index. 2020. ohi-global version: Global scenarios data for Ocean Health Index, [date downloaded]. National Center for Ecological Analysis and Synthesis, University of California, Santa Barbara. Available at github.com/OHI-Science/ohi-globaal/releases (Used the status dimension in this analysis )
References
Links
My Work:
Tableau Announcement
Useful Design Tools