IronOcean Palette
Part of the theYvonne Palette Library. See all palettes: Genderly Inclusive | Genderly | IronOcean | Twilight Coast | Red Dock | Crimson Brick

Palette Details
| Title, Text, Footer | #C4D4D9 | Beau Blue |
| Positive Result, Highlight Text | #41B7C4 | Maximum Blue Green |
| Highlight Text | #F0007B | Flickr Pink |
| Negative Result, Highlight Text | #F4743B | Orange Crayola |
| Background | #02343B | Rich Black |
| Background | #03172B | Oxford Blue |
Reading time: 25 secs
Usage
Used in Ocean and Marine Viz
Highlighting Positive and Negative Results
Description
This palette was created for IronViz 2021 competition. The theme was How Is The Oceans' Health. In this viz, I would have text, positive and negative info as well information to highlight.
I start the viz by finding a title slide image. I then explored the colors in the image using Image Color Picker. That is where I selected my background colors. Next, I used Coolors.co to choose colors that worked both in harmony and highlighting with the selected background colors.
Tableau Palette Code
Add the code snippet to your Preferences.tps, a xml file found in My Tableau Repository folder in your Documents directory. I typically Place above the </preferences> tag at the end. You can use a text or xml editor.
The story behind IronOcean:
This palette was created for IronViz 2021, Tableau's annual data visualization competition. The theme that year was ocean health. The starting point was not a color wheel but a title slide image: the palette was built by sampling colors directly from the image using Image Color Picker, then using Coolors.co to find harmonious accent colors that would work alongside those backgrounds.
The result is a palette designed for the specific challenge of visualizing ocean data where you need to show both positive and negative results clearly, alongside highlighted data points, all without the colors competing with each other.
What each color does:
Beau Blue (#C4D4D9) and Maximum Blue Green (#41B7C4) form the ocean background tones, drawing from the actual blue-green palette of open water. Flickr Pink (#F0007B) and Orange Crayola (#F4743B) serve as high-contrast highlights for positive findings or data points you want to draw attention to. Rich Black (#02343B) and Oxford Blue (#03172B) provide the deep, dark anchors for backgrounds, titles, and borders without pulling attention from the data.
Hex codes (copyable):
#C4D4D9 Beau Blue #41B7C4 Maximum Blue Green #F0007B Flickr Pink #F4743B Orange Crayola #02343B Rich Black #03172B Oxford Blue
When to use IronOcean:
Best suited for ocean, marine, environmental, and sustainability vizzes. Works particularly well when your data has a clear positive/negative or above/below structure and you need a highlight color that stands apart from the ocean blues without feeling out of place.
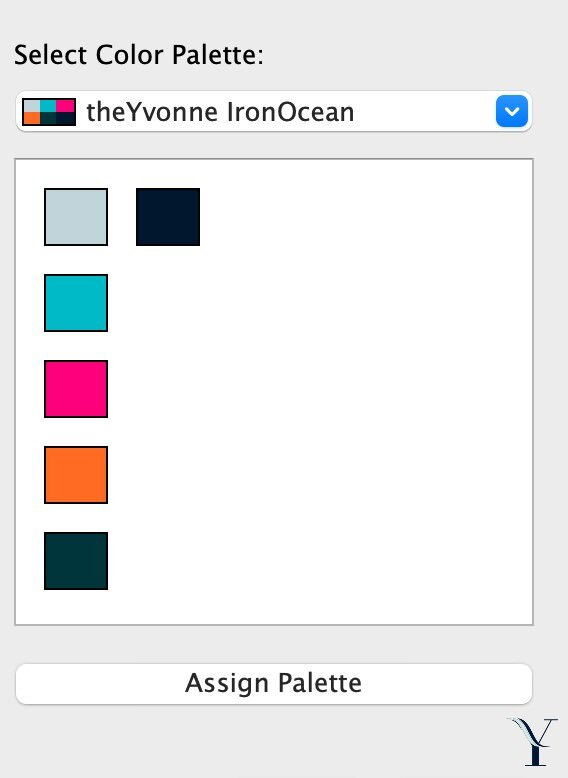
Tableau Code Snippet
<color-palette name="theYvonne IronOcean" type="regular" >
<color>#C4D4D9</color>
<color>#41B7C4</color>
<color>#F0007B</color>
<color>#F4743B</color>
<color>#02343B</color>
<color>#03172B</color>
</color-palette>
Preferences.tps Example File

Reference
Color Palette Information
To see all palettes I have designed for specific data analysis situations, review the Color Palette Portfolio Page. For more color palette tools and resources for data visualization, visit the Color Palette section of the Resources page — including tools specifically designed for accessible and inclusive design.
Example Viz
What do you think? Let me know on Twitter @YvonFitz.
Related Post You Might Enjoy


