
Thoughts and Ideas
Impact of a Super Spreader Event: Data Viz In the Wild
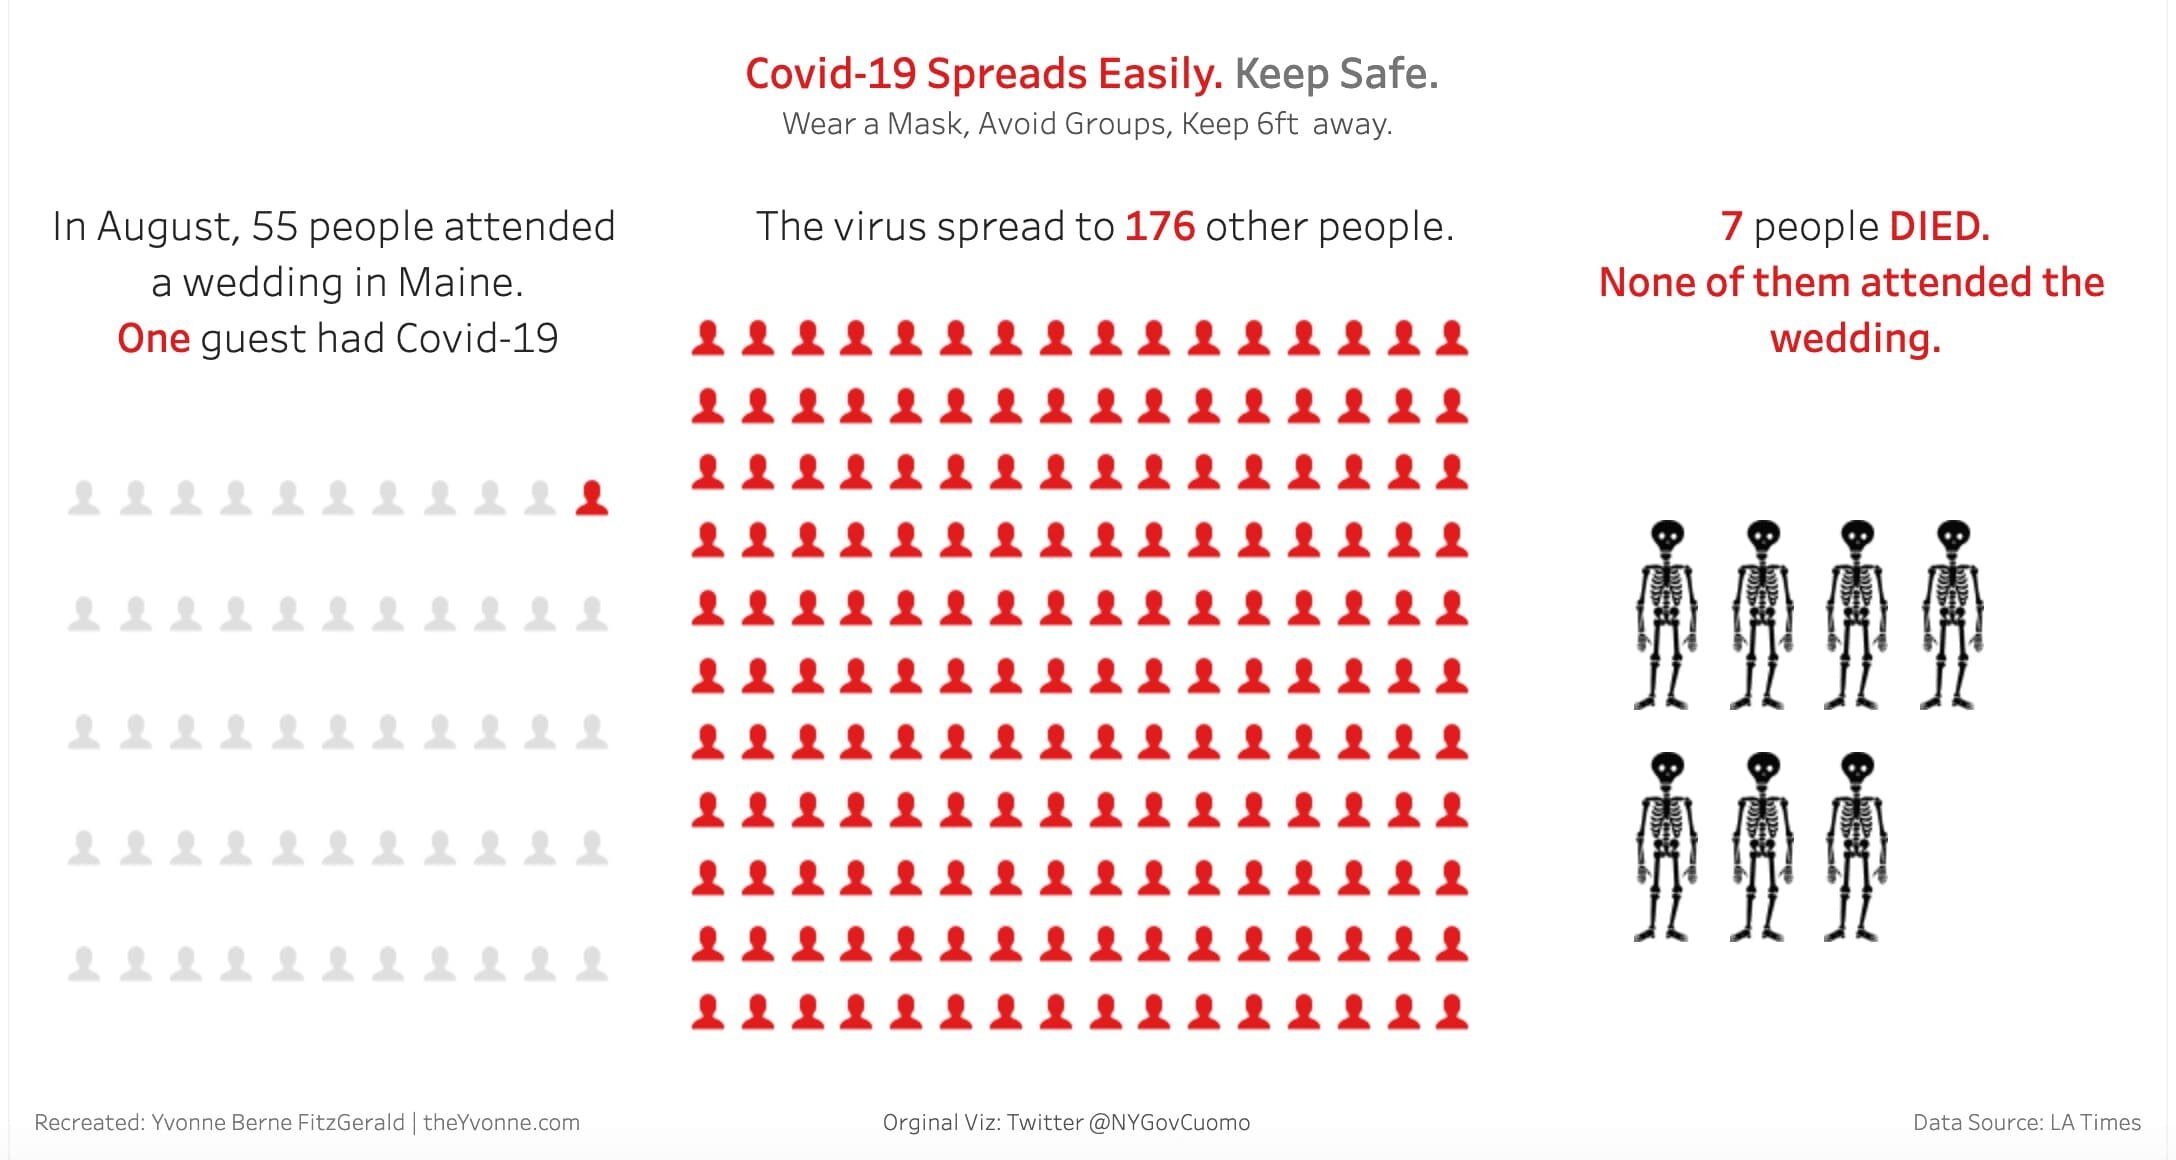
I saw a data visualization on Covid-19 Super Spreader Events by NY Gov Cuomo. I challenged myself to redesign the viz. #DataVizInTheWild
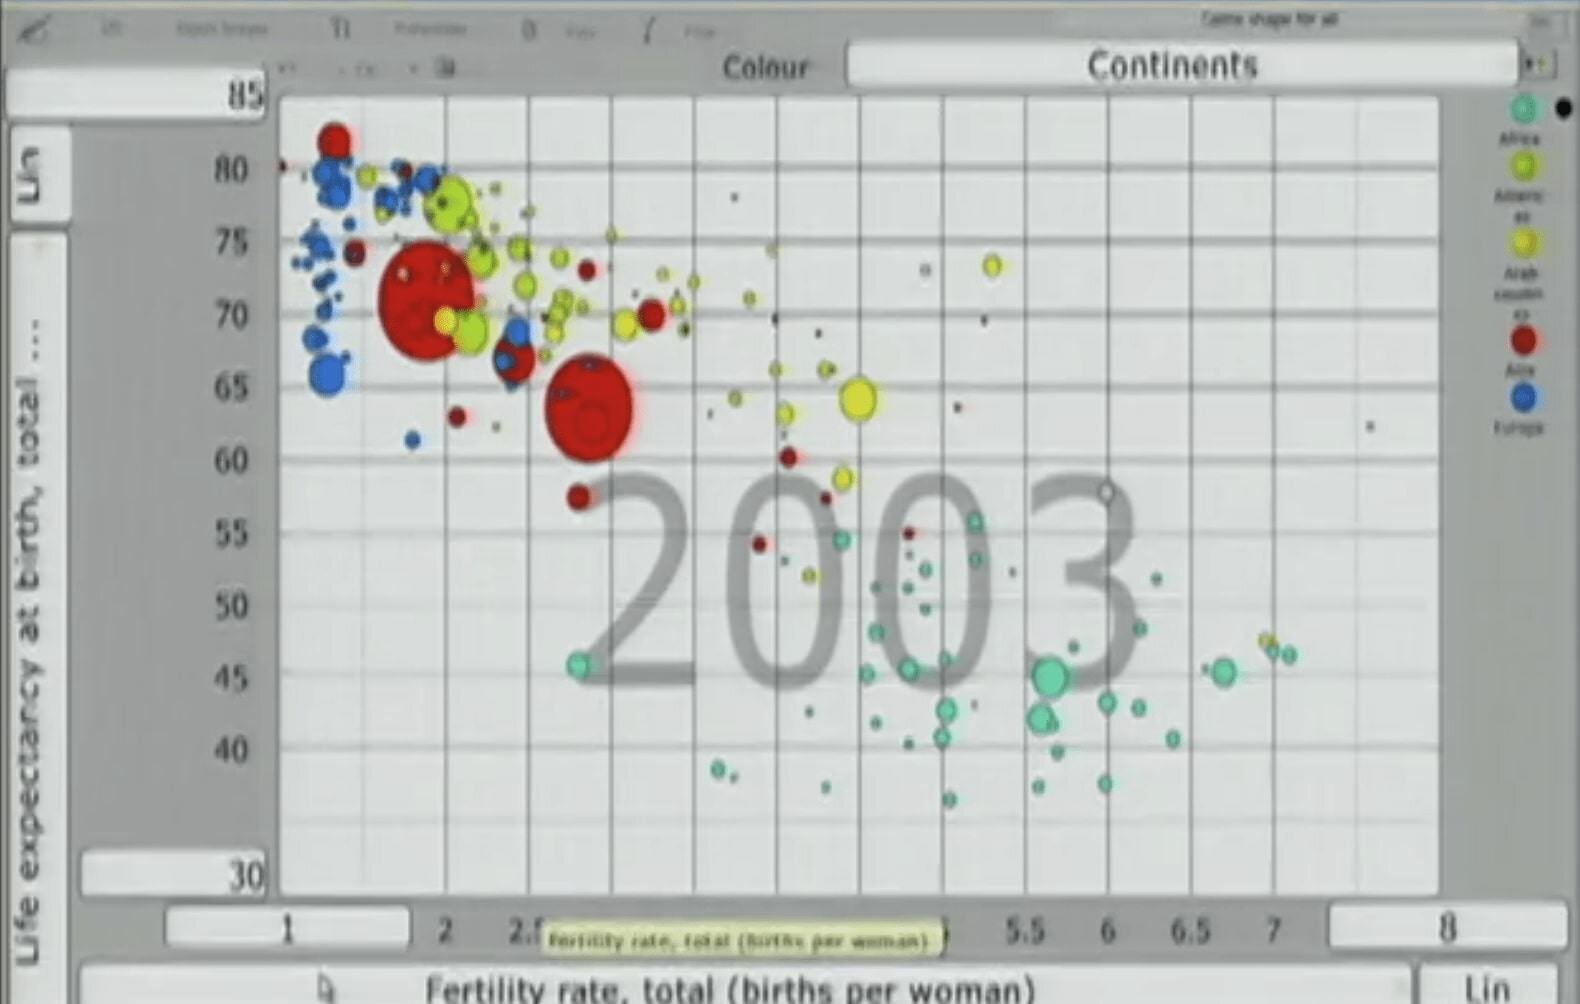
The Day I Fell In Love With Stats
The Ted Talk was by Hans Rosling. He was passionate, and the data did dance and moved and, in a way, sang. That's when I fell in love with stats.