Demons in the Data: A US “Scary Dream” Search Analysis
Community Challenge: Makeover Monday 2023 wk 40
My redesign (Tableau File Here):

Data Analysis Summary
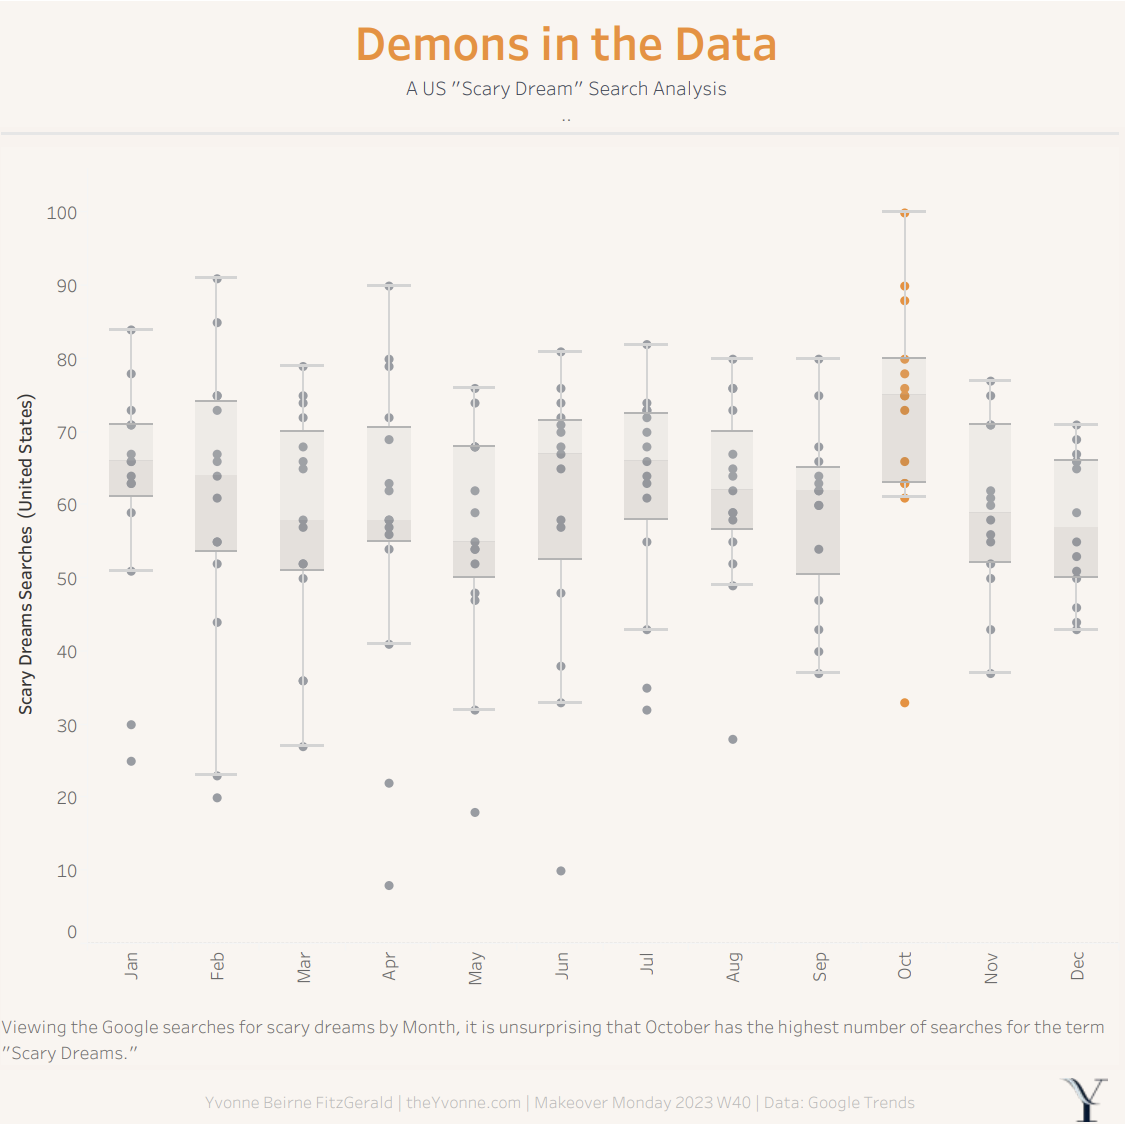
Analyzing Google Trends for the search term “Scary Dreams” by month from 2009 -2023, it is unsurprising that October had the highest search number.
Project Goals
Get Tableau back up and running on my computer
Create a Data Viz in under 1 hour
Complete this week’s Makeover Monday Challenge
Project Discussion
Key Findings
Analyzing Google Trends data for the search term "scary dreams" across the US from 2009 to 2023, one pattern dominates: October consistently produces the highest search volume of any month. This is not surprising given Halloween, but the data allows you to see just how pronounced that seasonal spike is relative to the rest of the year, and whether the trend has strengthened or weakened over time.
The visualization focuses on monthly search patterns rather than absolute numbers, making it easy to compare seasonal behavior year over year across the full 14-year period.
Data source: Google Trends, search term "scary dreams," United States, 2009 to 2023.
Challenges
Getting back into doing Makeover Monday Events was the primary challenge. I also wanted to set a 1-hour time limit, including time to reinstall Tableau.
Final Thoughts
Much more could be done with this dataset, but I kept to my one-hour limit. The constraint is the point — working fast forces decisions that a longer timeline would overthink. I can honestly say I do not have scary dreams. Do you — and do they cluster around Halloween?
For the Curious
What is Makeover Monday?
Makeover Monday is a weekly community data challenge where participants redesign an existing chart using the same underlying dataset. Each week a new dataset is released and participants share their entries on social media. The 2023 Week 40 dataset covered US Google Trends searches for "Scary Dreams.
What does US Google Trends data show about scary dreams searches?
Google Trends data for the search term "Scary Dreams" from 2009 to 2023 shows a strong seasonal pattern with October consistently recording the highest search volumes. The data covers 14 years of monthly US search trends and is available via the Makeover Monday 2023 Week 40 dataset on Data World.
Links & Additional Information
Challenge Information:
Article: Google Trends Search
Data Source: Makeover Monday Data Set 2023 week 40
Challenge Link: Makeover Monday Data Set 2023 week 40
Looking for datasets or tools to use in your own challenge submissions or additional community challenges? Visit the Resources page for a curated list of data viz tools, free datasets, and community challenges.
Related Post You Might Enjoy