
Thoughts and Ideas

Digital Gender Gap - Vis5 Visualizing Gender Equality
#Viz5 – The Digital Gender Gap is the Makeover Monday 2020 Week 44 challenge. In 2020 currently, about half of the world's population does not have access to the internet; most are women. This gap is leaving them behind for health, education, and financial information and opportunities.
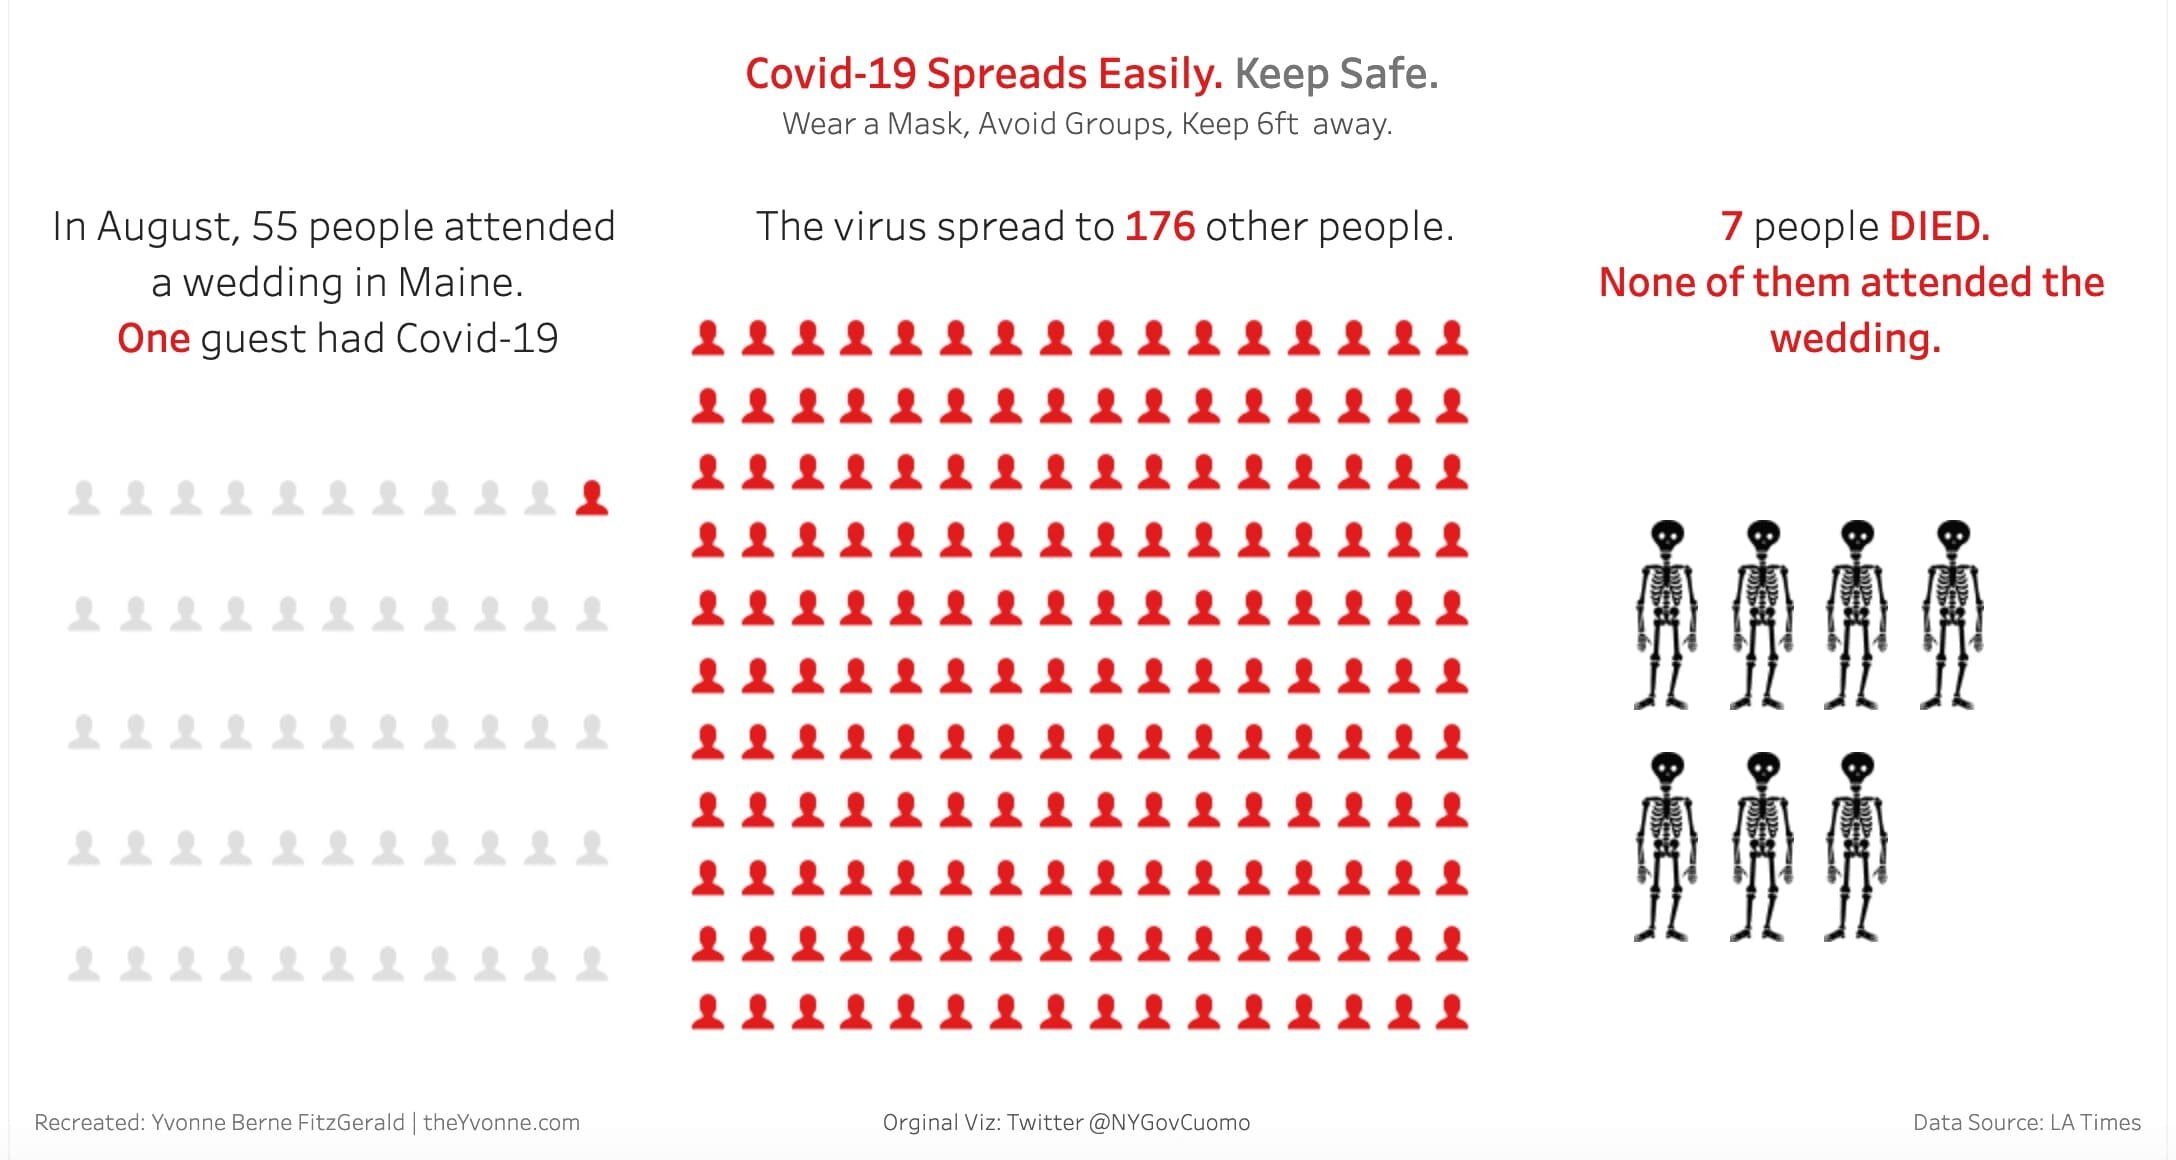
Impact of a Super Spreader Event: Data Viz In the Wild
I saw a data visualization on Covid-19 Super Spreader Events by NY Gov Cuomo. I challenged myself to redesign the viz. #DataVizInTheWild
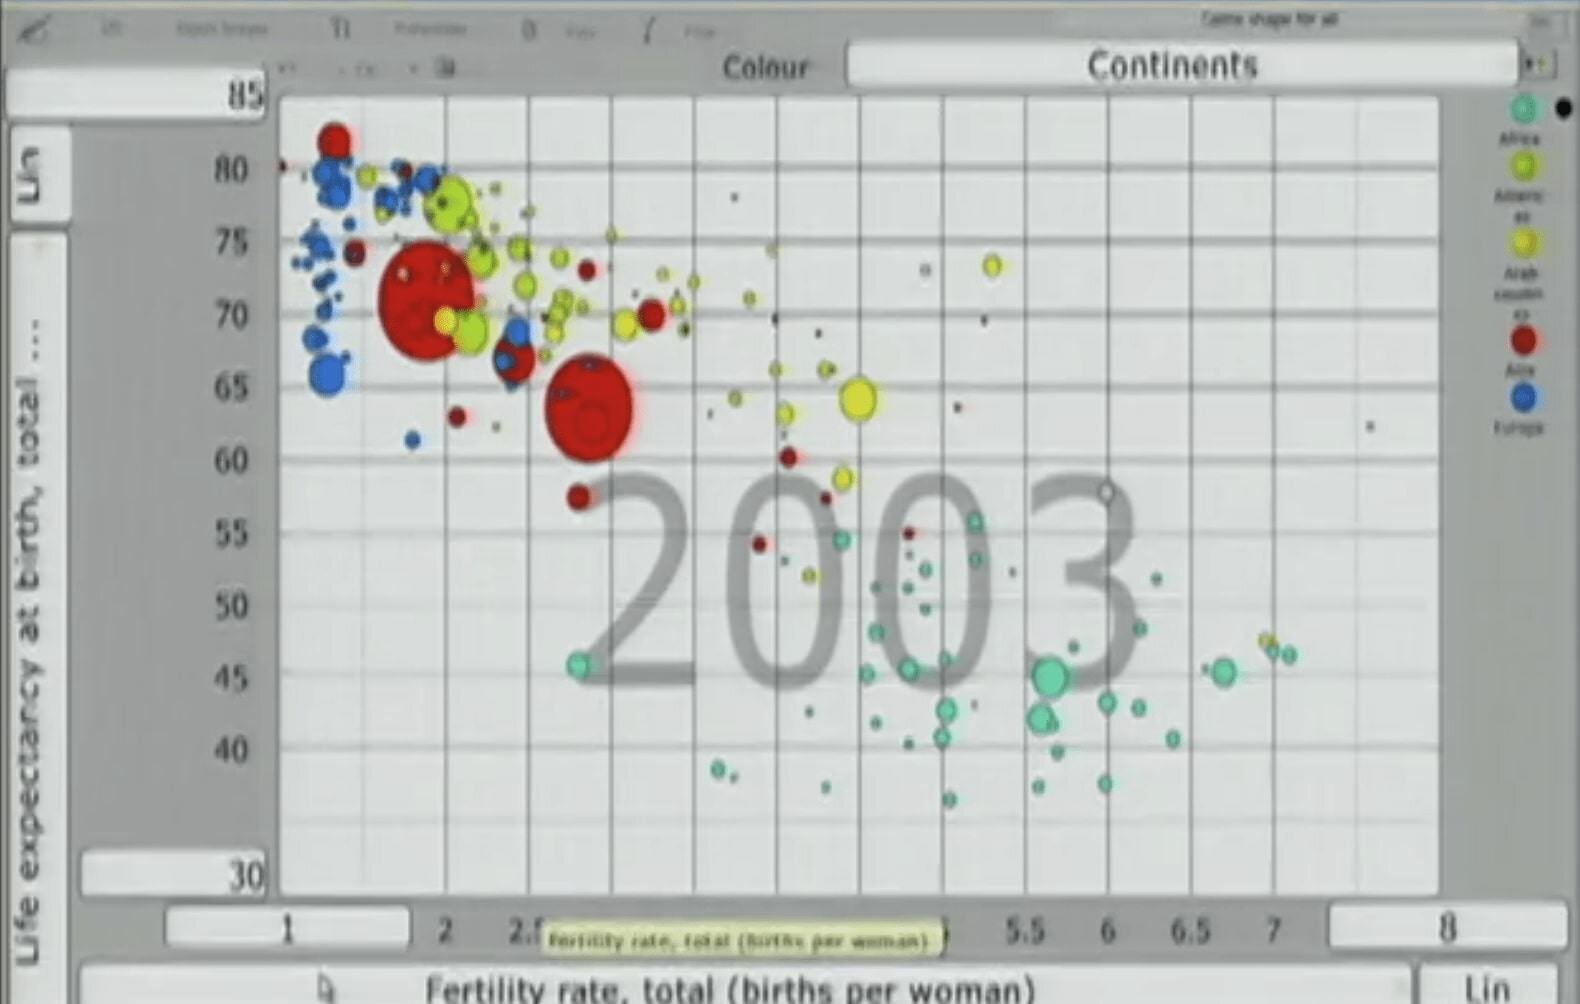
The Day I Fell In Love With Stats
The Ted Talk was by Hans Rosling. He was passionate, and the data did dance and moved and, in a way, sang. That's when I fell in love with stats.