Data Analysis & Visualization Challenges
Community Challenges and Self-Assigned Projects
By Yvonne Beirne FitzGerald | Updated: 2024
Project At A Glance
This collection brings together community challenges and self-assigned projects exploring topics from nurses' salaries to wildlife populations, plastic crisis to CEO pay ratios. Community challenges like Makeover Monday and Viz for Social Good provide a dataset and a deadline. Self-assigned projects start with a question worth answering and end with something a person can actually use. Each entry is built around a single focused takeaway, an elevator pitch in analytical form. The goal is always the same: make it clear, make it matter, make it useful.

What’s a Challenge?
About
Challenges start with a single theme, topic, or data set with a challenge to produce a visualization within a limited time. The time could be a week or a month. If you accept the challenge, what you learn is up to you. It may be a new chart type, calculation, way of looking at the data, or learning something from exploring a new data set. Upon completing the viz, you can share your work with the community to get feedback or say, “I completed this.” However, you choose to share or which challenges to accept the process will change you.
(Looking for datasets or tools to use in your own challenge submissions or additional community challenges? Visit the Resources page for a curated list of data viz tools, free datasets, and community challenges.)
“The beautiful thing about learning is that no one can take it away from you.”
— B.B. King

Design Decisions
I approach challenges as short, focused projects, typically one sheet with one viz. Though the data set is rich in ways to tell its story, my approach focuses on a key overarching theme. Creating an elevator viz for the data, highlighting the critical item I want the viewer to take away from the data set. I also use the challenges to try a new approach or view
Challenge Types

Self Assigned
From time to time, I will see a visualization in the wild that I want to recreate to learn how it was made or to change its style. I may also want to explore a data set to develop a quick viz with a given time limit.

Community Challenge
There is a community challenge to match each person. A list of challenges can be found on the My Resources page, in the Challenges section. Each challenge has its own hashtags and communities. The ability to see different visualization versions of the same data set you worked on gives you the ability to learn from the community and grow as an analyst.
Challenges are how skills grow fastest. A tight deadline, a shared dataset, and feedback from a community that cares about the work — that combination produces better results than working alone. Every challenge here taught something that carried forward into the next project.
Challenges


The work is never perfect. That is the point. Each one made the next one better.
For The Curious
What is Makeover Monday?
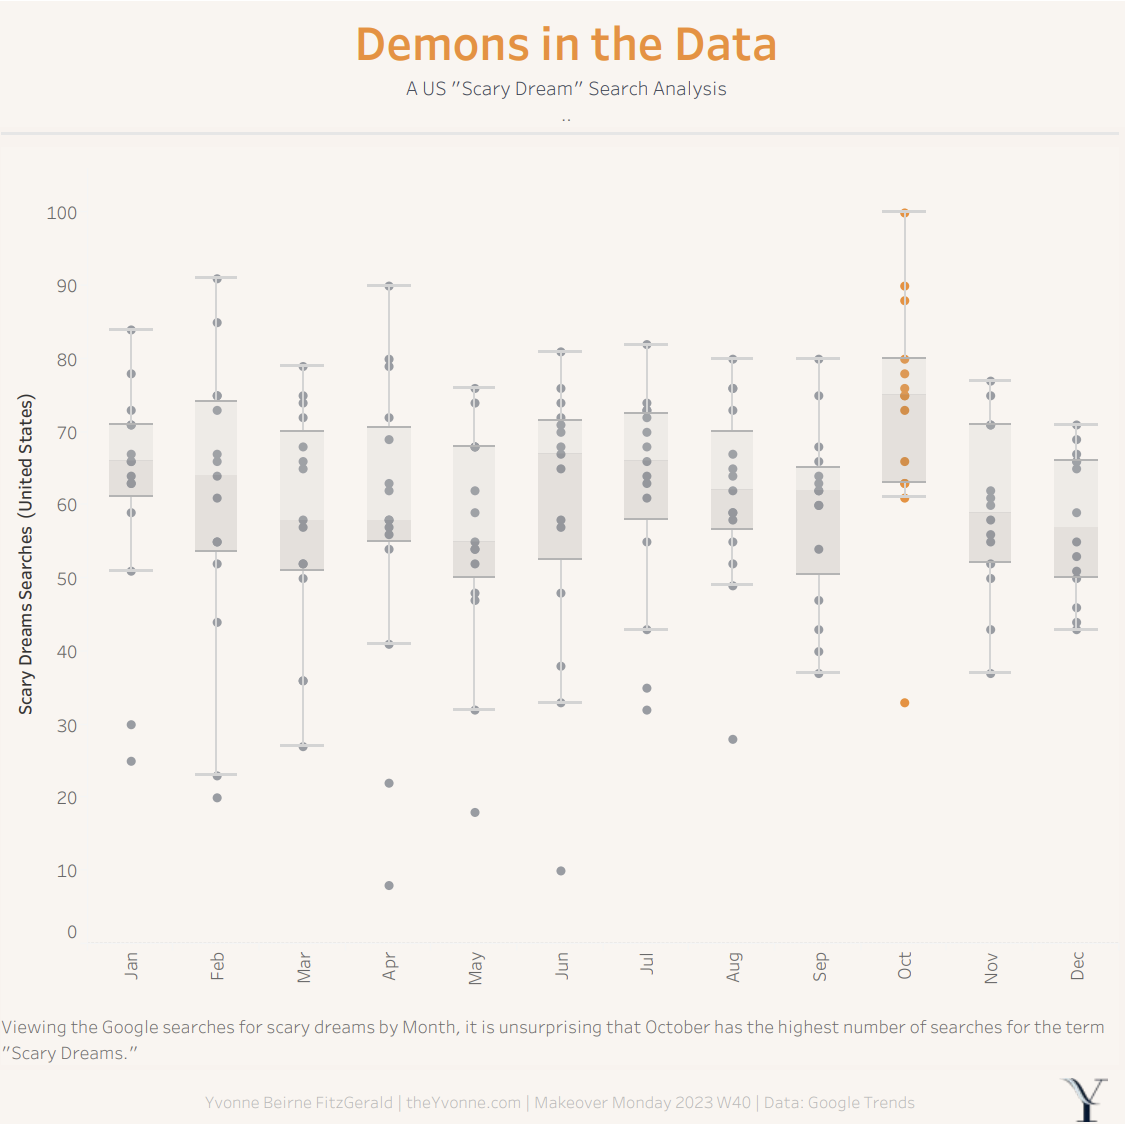
Makeover Monday is a weekly community challenge where participants redesign an existing chart using the same underlying data. It is one of the most active communities in the data world, running every week with a shared dataset and open feedback from participants and organizers.
What is Viz for Social Good?
Viz for Social Good is a community challenge in which participants create projects for non-profit organizations using real data provided by those organizations. The work is used directly by the non-profit, making it one of the most impactful challenge formats available.
What is a self-assigned challenge?
A self-assigned challenge is a project where the practitioner sets their own constraints — topic, dataset, deadline, and format. It builds the same skills as community challenges, but allows complete creative control over the subject matter and approach.
What is an elevator viz?
An elevator viz is a single-focused project built around one clear takeaway, the equivalent of an elevator pitch in analytical form. The constraint of one sheet, one theme, and one message produces cleaner and more impactful work than trying to show everything at once.
What topics are covered in these challenges?
Topics covered include nurses' salaries, wildlife populations, the plastic crisis, CEO pay ratios, mobile data costs, and more — each selected because the data tells a story worth understanding and sharing.